Local Government Report
The Local Government Report provides comprehensive information on remuneration and benefits across the Local Government sector
PARTICIPANTS & ROLES SURVEYED
PARTICIPANTS
82
COUNCILS &
COUNCIL-CONTROLLED
ORGANISATIONS
42,415
EMPLOYEES
269
JOBS
ROLES SURVEYED
- Community Services
- Corporate Services
- Customer Services
- Engineering / Technical
- Finance & Accounting
- Health & Safety
- Human Resources
- Information Management
- Information Communication Technology
- Marketing & Promotion
- Policy & Planning
- Regulatory Services
- Regional Council Roles
DISTRIBUTION, ANALYSIS & FEATURES
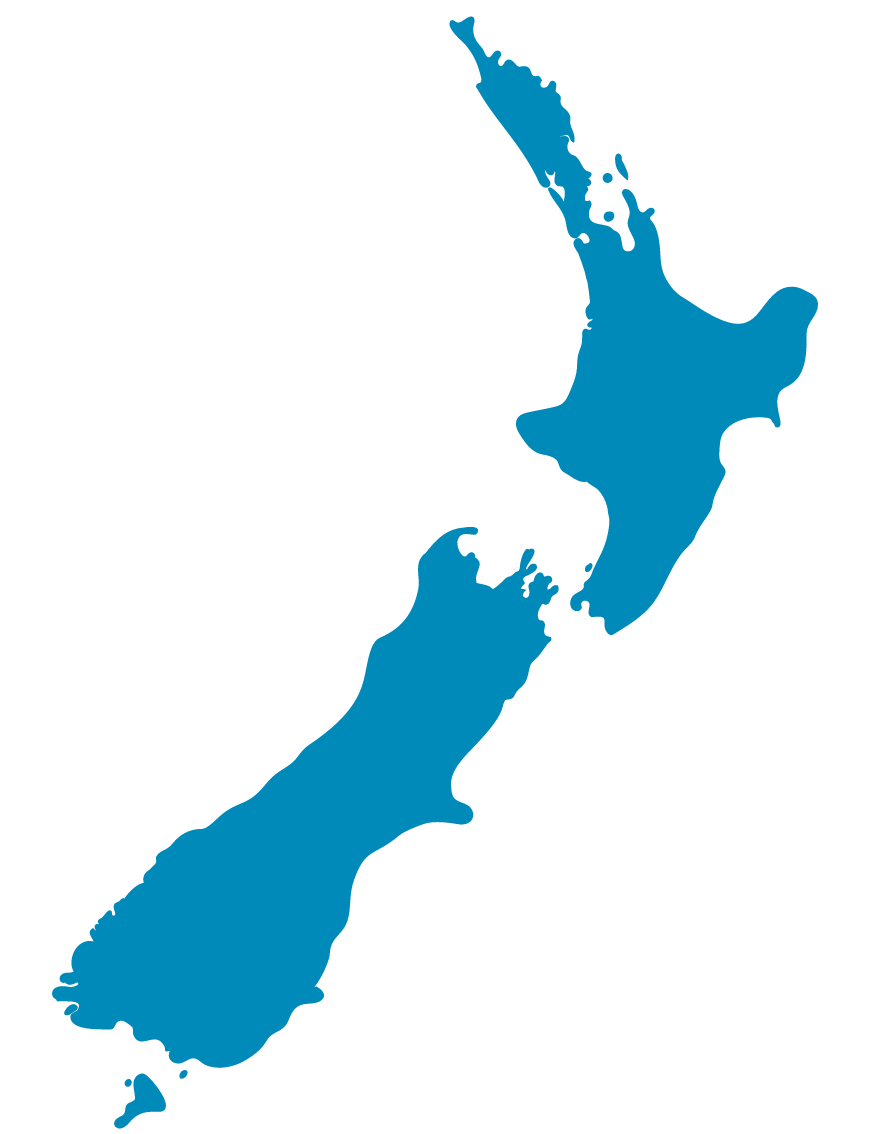
DISTRIBUTION BY REGION

OTHER NORTH ISLAND
49%
OTHER SOUTH ISLAND
29%
22%
METROPOLITAN
- Auckland
- Hamilton
- Wellington
- Christchurch
- Dunedin
- METROPOLITAN: 22%
Auckland
Hamilton
Wellington
Christchurch
Dunedin
- Other North Island: 49%
- Other South Island: 29%
ANALYSIS & FEATURES
- Market Movements
- Salary Increases and Forecasts
- The Metropolitan Factor
- Market Comparison Policies
- Tenure
- Standard Hours
- KiwiSaver
- Annual Leave
- Gender
PARTICIPATION
If you are interested in participating in the next survey, get in touch with our Survey Team
TIMING
This survey is published bi-annually, please contact us to participate.
2025 REPORT PRICES
PARTICIPANTS $1,395
NON-PARTICIPANTS $2,790
If you are interested in purchasing this survey report, please get in touch with our Survey Team
