Regional Councils & Unitary Authorities Report


The Regional Councils and Unitary Authorities Report is an annual benchmark report offering detailed remuneration and benefits information

PARTICIPANTS

ROLES SURVEYED

17

ORGANISATIONS

14,431

EMPLOYEES

46

JOBS

  • Land Management
  • Environmental Management
  • Operations / Engineering
  • Third Tier Management

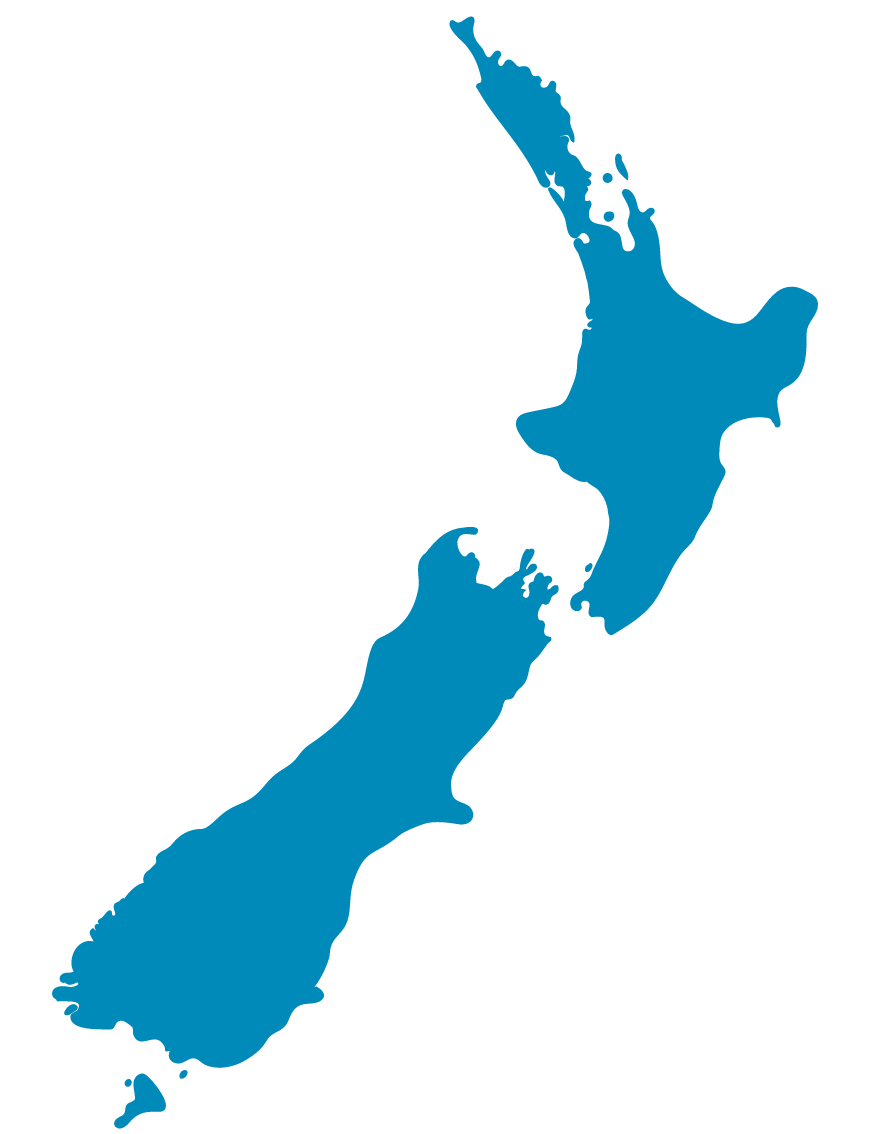
DISTRIBUTION BY REGION

ANALYSIS AND FEATURES

EVP Graphic 3

OTHER NORTH
ISLAND

35%

35%

METROPOLITAN

  • AUCKLAND
  • HAMILTON
  • WELLINGTON
  • CHRISTCHURCH
  • DUNEDIN

OTHER SOUTH
ISLAND

30%

  • Market Movements
  • Salary Increases and Forecasts
  • Market Comparison Policies
  • Tenure
  • Hours of Operation & Hours of Work
  • Annual Leave
  • Gender

PARTICIPATION

For more information about participation for this survey, get in touch with our Survey Team

TIMING

Data for this survey is collected from December to April, with the report published annually in May

2023 REPORT PRICES

PARTICIPANTS $720
NON PARTICIPANTS $1,440

The Regional Councils and Unitary Authorities Report is an annual benchmark report offering detailed remuneration and benefits information

PARTICIPANTS

17

ORGANISATIONS

14,431

EMPLOYEES

46

JOBS

ROLES SURVEYED

  • Land Management
  • Environmental Management
  • Operations / Engineering
  • Third Tier Management

DISTRIBUTION BY REGION

EVP Graphic 3

OTHER NORTH ISLAND

35%

35%

METROPOLITAN

  • AUCKLAND
  • HAMILTON
  • WELLINGTON
  • CHRISTCHURCH
  • DUNEDIN

OTHER SOUTH ISLAND

30%

ANALYSIS AND FEATURES

  • Market Movements
  • Salary Increases and Forecasts
  • Market Comparison Policies
  • Tenure
  • Hours of Operation & Hours of Work
  • Annual Leave
  • Gender

PARTICIPATION

For more information about participation for this survey, get in touch with our Survey Team

TIMING

Data for this survey is collected from December to April, with the report published annually in May

2023 REPORT PRICES

PARTICIPANTS $720
NON PARTICIPANTS $1,440

The Regional Councils and Unitary Authorities Report is an annual benchmark report offering detailed remuneration and benefits information

PARTICIPANTS

17

ORGANISATIONS

14,431

EMPLOYEES

46

JOBS

ROLES SURVEYED

  • Land Management
  • Environmental Management
  • Operations / Engineering
  • Third Tier Management

DISTRIBUTION BY REGION

Metropolitan (Auckland, Hamilton, Wellington, Christchurch & Dunedin): 35%
Other North Island: 35%
Other South Island: 30%

ANALYSIS AND FEATURES

  • Market Movements
  • Salary Increases and Forecasts
  • Market Comparison Policies
  • Tenure
  • Hours of Operation & Hours of Work
  • Annual Leave
  • Gender

PARTICIPATION

For more information about participation for this survey, get in touch with our Survey Team

TIMING

Data for this survey is collected from December to April, with the report published annually in May

2023 REPORT PRICES

PARTICIPANTS $720
NON PARTICIPANTS $1,440