New Zealand Remuneration Report


The New Zealand Remuneration Report reflects the full range of our database reporting on approximately 600 organisations across all sectors. It contains comprehensive remuneration information by Job Size (Grades and SP10 points) and by analysis of sector, region and function

PARTICIPANTS

ROLES SURVEYED

571

ORGANISATIONS

207,435

EMPLOYEES

70%

PRIVATE

28%

PUBLIC

2%

NOT FOR PROFIT

  • Administration & Support
  • Customer Services & Support
  • Engineering / Technical
  • Finance & Accounting
  • Health / Medical
  • Health & Safety
  • Human Resources
  • Information Management
  • Information Communication Technology
  • Legal, Risk & Compliance
  • Manufacturing Operations
  • Marketing & Communications
  • Operations / Service Delivery
  • Policy & Planning
  • Property Management & Services
  • Sales
  • Science & Research
  • Supply Chain & Procurement
  • Trades & Labouring

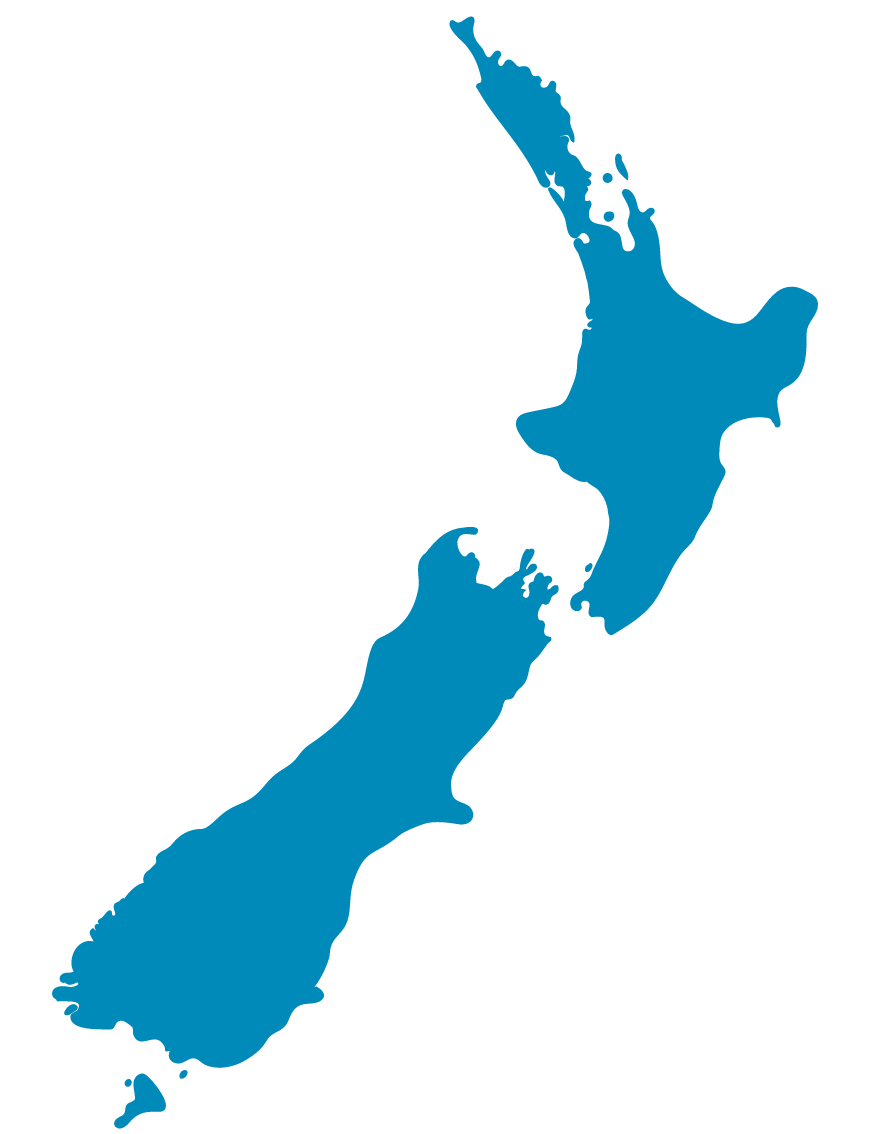
DISTRIBUTION BY REGION

ANALYSIS AND FEATURES

EVP Graphic 3

GREATER
AUCKLAND

30%

WAIKATO /
BOP

12%

OTHER NORTH
ISLAND

8%

3%

GISBORNE /
HAWKES BAY

14%

GREATER
WELLINGTON

OTHER SOUTH
ISLAND

10%

16%

CANTERBURY
REGION

6%

OTAGO
REGION

  • Market Movements
  • Whole Sample Market Movements
  • Salary Projections
  • Benefits Analysis
  • Performance Bonuses
  • KiwiSaver
  • Metropolitan / Regional Differences
  • Variances by Job Function

PARTICIPATION

If you are interested in participating in the next survey, get in touch with our Survey Team

TIMING

MARCH SURVEY – Data is collected from January to March with the report published annually in May

SEPTEMBER SURVEY – Data is collected from July to September with the report published annually in November

2023 REPORT PRICES

General Market + Private / Public Sector $3,500
Full Report $4,500
(PARTICIPANT RATE)

The New Zealand Remuneration Report reflects the full range of our database reporting on approximately 600 organisations across all sectors. It contains comprehensive remuneration information by Job Size (Grades and SP10 points) and by analysis of sector, region and function

PARTICIPANTS

571

ORGANISATIONS

207,435

EMPLOYEES

70%

PRIVATE

28%

PUBLIC

2%

NOT FOR PROFIT

ROLES SURVEYED

  • Administration & Support
  • Customer Services & Support
  • Engineering / Technical
  • Finance & Accounting
  • Health / Medical
  • Health & Safety
  • Human Resources
  • Information Management
  • Information Communication Technology
  • Legal, Risk & Compliance
  • Manufacturing Operations
  • Marketing & Communications
  • Operations / Service Delivery
  • Policy & Planning
  • Property Management & Services
  • Sales
  • Science & Research
  • Strategic Planning & Business Improvement
  • Supply Chain & Procurement
  • Trades & Labouring

DISTRIBUTION BY REGION

EVP Graphic 3

GREATER
AUCKLAND

31%

WAIKATO / BOP

12%

OTHER NORTH
ISLAND

8%

3%

GISBORNE /
HAWKES BAY

14%

GREATER WELLINGTON

OTHER SOUTH ISLAND

10%

16%

CANTERBURY
REGION

6%

OTAGO REGION

ANALYSIS AND FEATURES

  • Market Movements
  • Whole Sample Market Movements
  • Salary Projections
  • Benefits Analysis
  • Performance Bonuses
  • KiwiSaver
  • Metropolitan / Regional Differences
  • Variances by Job Function

PARTICIPATION

If you are interested in participating in the next survey, get in touch with our Survey Team

TIMING

MARCH SURVEY – Data is collected from January to March, with the report published annually in May

SEPTEMBER SURVEY – Data is collected from July to September with the report published annually in November

2023 REPORT PRICES

General Market + Private / Public Sector $3,500
Full Report $4,500
(PARTICIPANT RATE)

The New Zealand Remuneration Report reflects the full range of our database reporting on approximately 600 organisations across all sectors. It contains comprehensive remuneration information by Job Size (Grades and SP10 points) and by analysis of sector, region and function

PARTICIPANTS

571

ORGANISATIONS

207,435

EMPLOYEES

70%

PRIVATE

28%

PUBLIC

2%

NOT FOR PROFIT

ROLES SURVEYED

  • Administration & Support
  • Customer Services & Support
  • Engineering / Technical
  • Finance & Accounting
  • Health / Medical
  • Health & Safety
  • Human Resources
  • Information Management
  • Information Communication Technology
  • Legal, Risk & Compliance
  • Manufacturing Operations
  • Marketing & Communications
  • Operations / Service Delivery
  • Policy & Planning
  • Property Management & Services
  • Sales
  • Science & Research
  • Strategic Planning & Business Improvement
  • Supply Chain & Procurement
  • Trades & Labouring

DISTRIBUTION BY REGION

Greater Auckland: 30%
Waikato/Bay of Plenty: 12%
Gisborne/Hawke’s Bay: 3%
Other North Island: 8%
Greater Wellington: 16%
Other South Island: 10%
Canterbury Region: 16%
Otago Region: 6%

ANALYSIS AND FEATURES

  • Market movements
  • Whole sample market movements
  • Salary projections
  • Benefits analysis
  • Performance bonuses
  • KiwiSaver
  • Metropolitan / Regional differences
  • Variances by job function

PARTICIPATION

If you are interested in participating in the next survey, get in touch with our Survey Team

TIMING

MARCH SURVEY – Data is collected from January to March, with the report published annually in May

SEPTEMBER SURVEY – Data is collected from July to September, with the report published annually in November

2023 REPORT PRICES

General Market + Private / Public Sector $3,500
Full Report $4,500
(PARTICIPANT RATE)