New Zealand Directors' Fees Report
The New Zealand Directors’ Fees Report covers current trends and practices relating to the payment of directors’ fees within New Zealand private and public organisations. Annual fees and total hours statistics are split by type of organisation, industry, turnover, asset size, number of employees and shareholder funds
PARTICIPANTS
SOURCES
400
BOARDS
2,522
DIRECTORSHIPS
383
NON-EXECUTIVE CHAIRS
1,878
NON-EXECUTIVE DIRECTORS
- Organisations from the Strategic Pay database
- Questionnaires sent to Strategic Pay mailing list
- Publicly available annual reports and NZX listings
The core of the survey contains schedules detailing quartile amounts of fees for each class of director
Policy and practice results are reported on separately
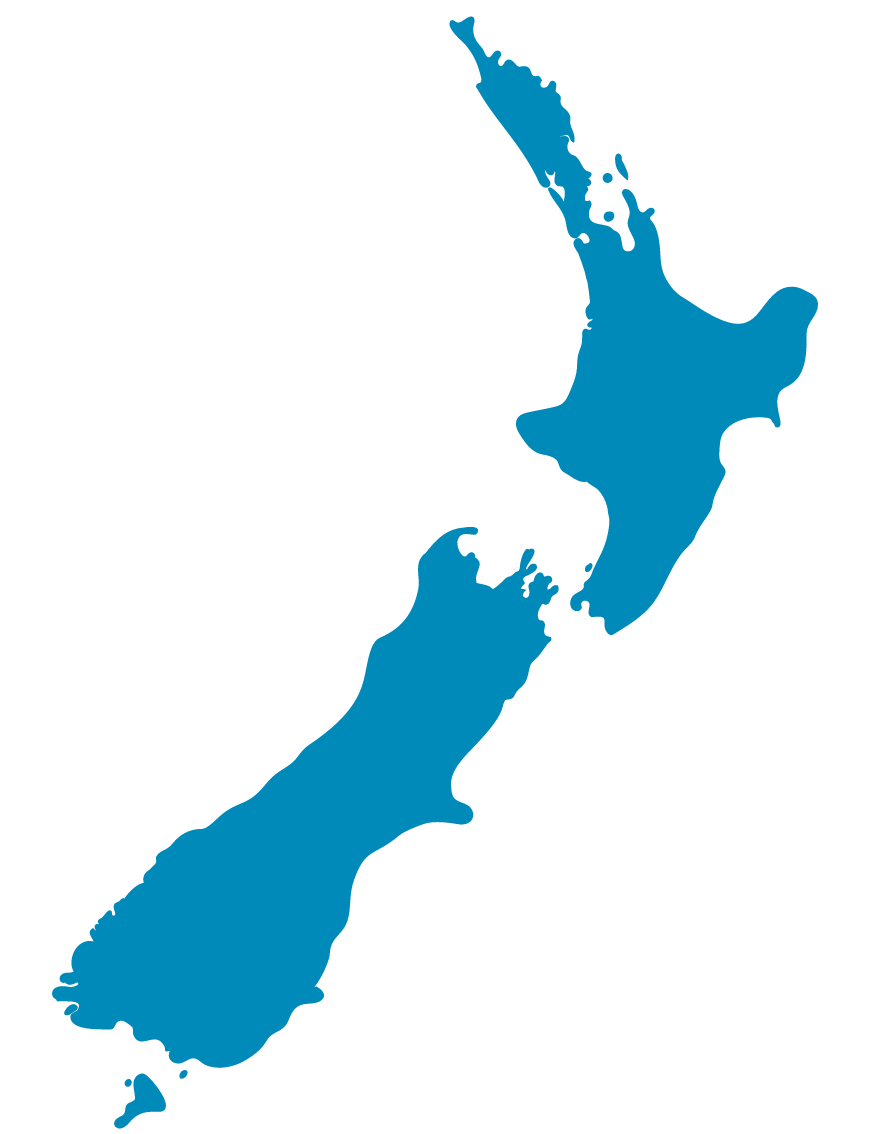
DISTRIBUTION BY REGION
ANALYSIS AND FEATURES
GREATER
AUCKLAND
33%
OTHER NORTH
ISLAND
19%
23%
GREATER
WELLINGTON
SOUTH ISLAND
25%
- Schedules of Directors’ Fees
- Summary Information
- Board Policy & Practice Analysis
- Directorship Gender Analysis
PARTICIPATION
If you are interested in participating in the next survey, get in touch with our Survey Team
TIMING
Data for this report is collected from November to February, with the report published annually in March
2023 REPORT PRICES
PARTICIPANTS $700
NON-PARTICIPANTS $1,400
The New Zealand Directors’ Fees Report covers current trends and practices relating to the payment of directors’ fees within New Zealand private and public organisations. Annual fees and total hours statistics are split by type of organisation, industry, turnover, asset size, number of employees and shareholder funds. Participation is open to all organisations in New Zealand
PARTICIPANTS
400
BOARDS
2,522
DIRECTORSHIPS
383
NON-EXECUTIVE CHAIRS
1,878
NON-EXECUTIVE DIRECTORS
SOURCES
- Organisations from the Strategic Pay database
- Questionnaires sent to the Strategic Pay mailing list
- Publicly available annual reports and NZX listings
The core of the report contains schedules detailing quartile amounts of fees for each class of director
Policy and practice results are reported separately
DISTRIBUTION BY REGION
GREATER
AUCKLAND
33%
OTHER NORTH
ISLAND
19%
23%
GREATER
WELLINGTON
SOUTH ISLAND
25%
ANALYSIS AND FEATURES
- Schedules of Directors’ Fees
- Summary Information
- Board Policy & Practice Analysis
- Directorship Gender Analysis
PARTICIPATION
If you are interested in participating in the next survey, get in touch with our Survey Team
TIMING
Data for this report is collected from November to February, with the report published annually in March
2023 REPORT PRICES
PARTICIPANTS $700
NON-PARTICIPANTS $1,400
The New Zealand Directors’ Fees Report covers current trends and practices relating to the payment of directors’ fees within New Zealand private and public organisations. Annual fees and total hours statistics are split by type of organisation, industry, turnover, asset size, number of employees and shareholder funds. Participation is open to all organisations in New Zealand
PARTICIPANTS
400
BOARDS
2,522
DIRECTORSHIPS
383
NON-EXECUTIVE CHAIRS
1,878
NON-EXECUTIVE DIRECTORS
SOURCES
- Organisations from the Strategic Pay database
- Questionnaires sent to the Strategic Pay mailing list
- Publicly available annual reports and NZX listings
The core of the survey contains schedules detailing quartile amounts of fees for each class of director
Policy and practice results are reported seperately
DISTRIBUTION BY REGION
Greater Auckland: 33%
Other North Island: 19%
Greater Wellington: 23%
South Island: 25%
ANALYSIS AND FEATURES
- Schedules of Directors’ Fees
- Summary Information
- Board Policy & Practice Analysis
- Directorship Gender Analysis
PARTICIPATION
If you are interested in participating in the next survey, get in touch with our Survey Team
TIMING
Data for this report is collected from November to February, with the report published annually in March
2023 REPORT PRICES
PARTICIPANTS $700
NON-PARTICIPANTS $1,400