Construction Industry Report


The Construction Industry Report provides comprehensive information on remuneration and benefits for industry-specific benchmark positions across the New Zealand Market

PARTICIPANTS

ROLES SURVEYED

161

ORGANISATIONS

43,258

EMPLOYEES

69

JOBS

  • Managemt Office – Construction
  • Project Management –
    All Construction
  • Project Management –
    Civil Construction
  • Project Management –
    Industrial / Commercial Construction
  • Project Management –
    Residential Construction
  • Construction Site / Contractor Management
  • Quantity Surveying & Estimation – Construction
  • Procurement – Construction
  • Trades & Labouring

DISTRIBUTION BY REGION

ANALYSIS AND FEATURES

EVP Graphic 3

AUCKLAND

36%

OTHER NORTH
ISLAND

27%

9%

WELLINGTON

OTHER SOUTH
ISLAND

12%

16%

CHRISTCHURCH /
CANTERBURY REGION

  • Market Movements
  • Salary Increases and Forecasts
  • Market Comparison Policies
  • KiwiSaver
  • Bonuses
  • Tenure
  • Gender

PARTICIPATION

If you are interested in participating in the next survey, get in touch with our Survey Team

TIMING

Data for this survey is collected from January to April, with the report published annually in May

2023 REPORT PRICES

PARTICIPANTS $1,568
NON-PARTICIPANTS $3,136

The Construction Industry Report provides comprehensive information on remuneration and benefits for industry-specific benchmark positions across the New Zealand Market

PARTICIPANTS

161

ORGANISATIONS

43,258

EMPLOYEES

69

JOBS

ROLES SURVEYED

  • Managemt Office –
    Construction
  • Project Management –
    All Construction
  • Project Management –
    Civil Construction
  • Project Management –
    Industrial / Commercial Construction
  • Project Management –
    Residential Construction
  • Construction Site / Contractor Management
  • Quantity Surveying & Estimation – Construction
  • Procurement – Construction
  • Trades & Labouring

DISTRIBUTION BY REGION

EVP Graphic 3

AUCKLAND

36%

OTHER NORTH
ISLAND

27%

9%

WELLINGTON

OTHER SOUTH
ISLAND

12%

16%

CHRISTCHURCH / CANTERBURY REGION

ANALYSIS AND FEATURES

  • Market Movements
  • Salary Increases and Forecasts
  • Market Comparison Policies
  • KiwiSaver
  • Bonuses
  • Tenure
  • Gender

PARTICIPATION

If you are interested in participating in the next survey, get in touch with our Survey Team

TIMING

Data for this survey is collected from January to April, with the report published annually in May

2023 REPORT PRICES

PARTICIPANTS $1,568
NON-PARTICIPANTS $3,136

The Construction Industry Report provides comprehensive information on remuneration and benefits for industry-specific benchmark positions across the New Zealand Market

PARTICIPANTS

161

ORGANISATIONS

43,258

EMPLOYEES

69

JOBS

ROLES SURVEYED

  • Managemt Office – Construction
  • Project Management – All Construction
  • Project Management – Civil Construction
  • Project Management – Industrial / Commercial Construction
  • Project Management – Residential Construction
  • Construction Site / Contractor Management
  • Quantity Surveying & Estimation – Construction
  • Procurement – Construction
  • Trades & Labouring

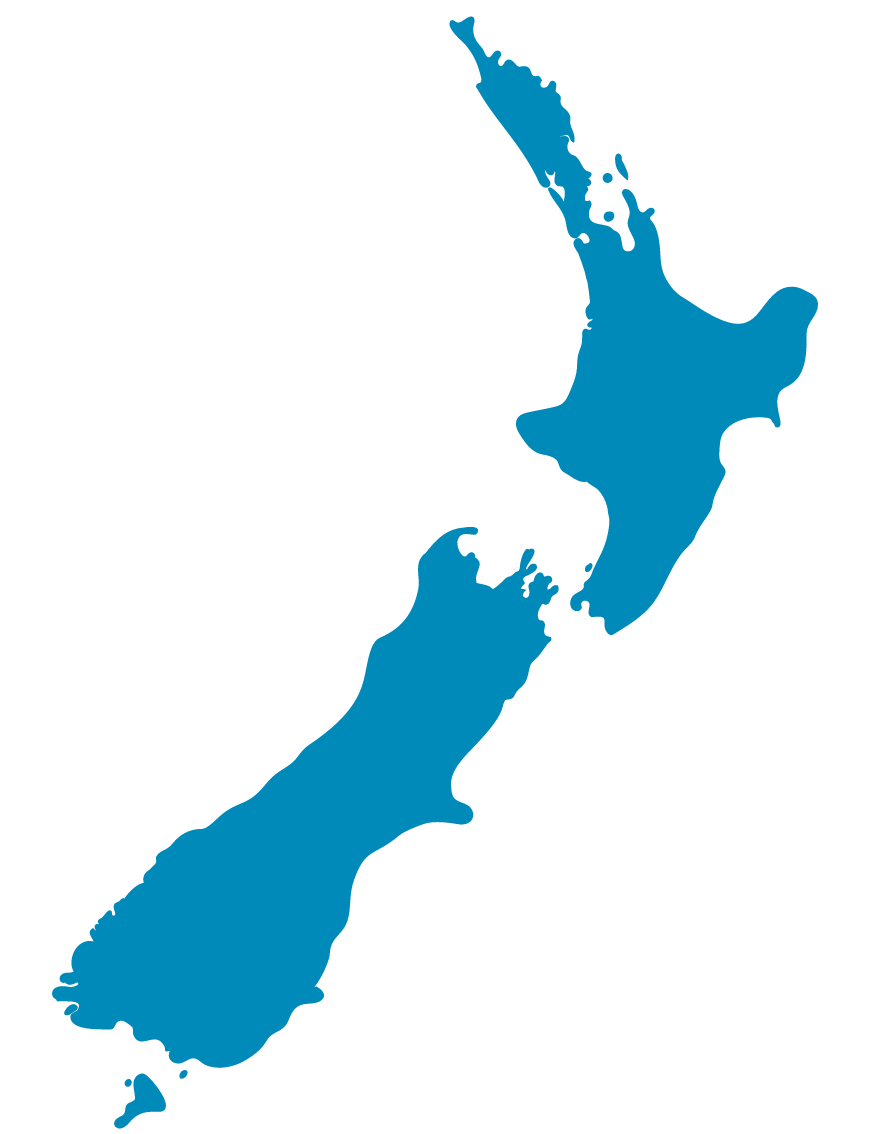
DISTRIBUTION BY REGION

Auckland: 36%
Other North Island: 27%
Wellington: 9%
Other South Island: 12%
Christchurch/Canterbury Region: 16%

ANALYSIS AND FEATURES

  • Market movements
  • Salary increases and forecast trends
  • Market comparison policies
  • KiwiSaver
  • Bonuses
  • Tenure
  • Gender

PARTICIPATION

If you are interested in participating in the next survey, get in touch with our Survey Team

TIMING

Data for this survey is collected from January to April, with the report published annually in May

2023 REPORT PRICES

PARTICIPANTS $1,568
NON-PARTICIPANTS $3,136